Industrial Excitement Labs
Design and data
How this portfolio was designed, and a live data dashboard. Each demo opens in its own window, with the same display and accessibility settings as this page.
Try this first: the live UK Grid dashboard.
Designing with AI
I design this portfolio with Claude, one decision at a time. Claude makes working options in HTML, I review each round in a browser, and I choose or combine what works.
Making a new version takes minutes. The real work is keeping every decision, so nothing I rejected comes back in a later round. So every piece of feedback becomes a rule:
- An extended memory folder holds my rules, ways of working, and a dated log of every decision. Claude reads it before each piece of work, so a new session starts from what I have already decided.
- A list of dos and do nots grows with each round. For example: my Content Design System writing rules, and no removed labels coming back.
- Skills hold the ways of working, such as how I write and check a tailored CV.
How a round works now
- Brief. I say what I want in a sentence or two, often while the last change is still being built.
- Research. Claude looks up what it needs, such as current prices or the limits of a tool, and lists its sources.
- Build. Claude changes the source files on my computer and builds the pages.
- Test. Every changed page opens in a browser, in light and dark mode and at phone width, and each demo is run from start to finish.
- Check. An automatic check reads every sentence against my Content Design System, and an accessibility scan tests every page.
- Review and commit. I review the result, Claude commits it to git, and I publish it.
The rules that never change
- The public build checks itself. It stops if my name or my employer’s name appears on any public page.
- Claude never types my password. I run the encrypted build myself, and Claude checks that the result kept the same key.
- Nothing is committed with a known accessibility failure. Every page passes the scan first.
The design studies are the real files from that process: nine directions, five font pairings, and five gallery layouts. The newest is a storyboard for a five-minute animated history of Roman London, made with the same rules.
 Experiments
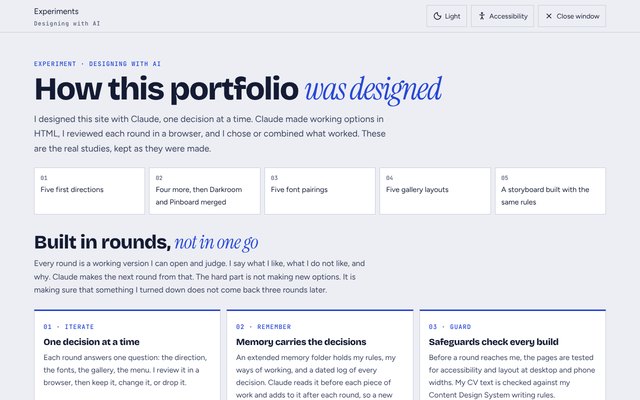
Experiment: how this portfolio was designed
The real design studies from building this site with Claude. There are nine directions, five font pairings, and five gallery layouts, each with a note on what I chose.
UK Grid: Live+
A live dashboard of Great Britain's electricity grid, designed by me and coded with Claude. It shows the generation mix, demand, price and carbon intensity, with history from a day to a decade.
Every data source has a plain-English explainer, and there are pages for Europe and the Americas. A custom Claude skill keeps the records panels accurate. The data comes from Elexon, the National Energy System Operator, and the Carbon Intensity application programming interface (API).
Screenshots of the live site taken on 15 October 2026. The figures change every half hour.